Oil production in the US peaked in 1970. The easy ?sweeter? stuff has been extracted. What remains is deeper in the ground or farther off-shore, requires much more energy to extract, and is more toxic to produce. It takes energy to make energy. Energy Return on Investment (EROI) also known as?ERoEI?(Energy Returned on Energy Invested), is a common way of expressing the efficiency of the energy production process. The EROI for oil and gas, as well as other fossil fuels,?has been falling for decades (see chart below). If it was a financial stock, you would have sold it years ago.
The Ouroboros
It is important to track EROI. Producing a barrel of oil consumes more and more energy, thus exponentially?accelerating the consumption of the oil. It is like the mythic Ouroboros?-?a snake eating its own tail. A high EROI is better than low EROI. As we approach an EROI of 1:1 (e.g.?consuming 1 barrel of oil to produce 1 barrel of oil), it?s game over ? why bother. Prudent nations would want to have a comprehensive plan for transitioning to alternative fuels and renewable energy, well before we hit peak oil. Oh well? More on that in a minute (see The Hirsch Report, below).
This week, a team of researchers published a detailed analysis of the EROI for oil and gas industry. The report,?A New Long Term Assessment of Energy Return on Investment (EROI) for U.S. Oil and Gas Discovery and Production, is authored by researchers at?State University of New York and Boston University.
From the abstract:
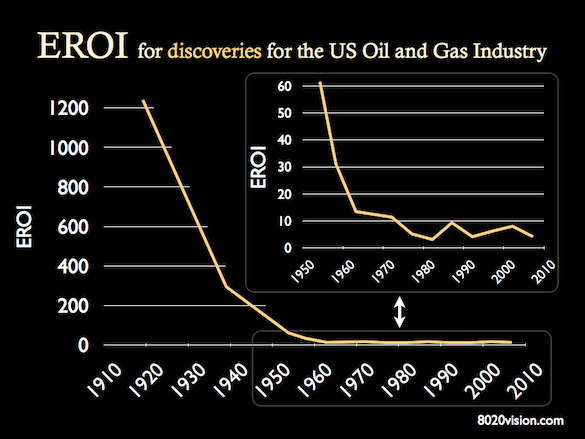
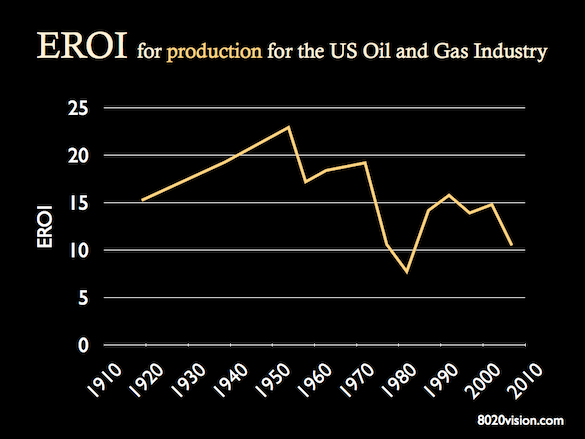
Oil and gas are the main sources of energy in the United States. Part of their appeal is the high Energy Return on Energy Investment (EROI) when procuring them. We assessed data from the United States Bureau of the Census of Mineral Industries, the Energy Information Administration (EIA), the Oil and Gas Journal for the years 1919?2007 and from oil analyst Jean Laherrere to derive EROI for both finding and producing oil and gas. We found two general patterns in the relation of energy gains compared to energy costs: a gradual secular decrease in EROI and an inverse relation to drilling effort. EROI for finding oil and gas decreased exponentially from 1200:1 in 1919 to 5:1 in 2007. The EROI for production of the oil and gas industry was about 20:1 from 1919 to 1972, declined to about 8:1 in 1982 when peak drilling occurred, recovered to about 17:1 from 1986?2002 and declined sharply to about 11:1 in the mid to late 2000s. The slowly declining secular trend has been partly masked by changing effort: the lower the intensity of drilling, the higher the EROI compared to the secular trend. Fuel consumption within the oil and gas industry grew continuously from 1919 through the early 1980s, declined in the mid-1990s, and has increased recently, not surprisingly linked to the increased cost of finding and extracting oil.
As we deplete the earths global oil reserves, we need to dig deeper and deeper ? typically drilling over 100 million feet of well per year. It takes enormous amounts of energy and resources to do that, not to mention the energy consumed just to figure out where to drill. The next two charts show the EROI for oil and gas discovery and production.
(source: Guilford, Hall, Connor, Cleveland ?A New Long Term Assessment of Energy Return on Investment (EROI) for U.S. Oil and Gas Discovery and Production.? Sustainability 2011, 3, 1866-1887)
For the Discovery chart above, note that in the early days of oil exploration, the stuff was practically bubbling out of the ground, so it was much easier to figure out where to drill ? hence the EROI over 1,200 in 1920. As the US industrial age found its legs, oil consumption accelerated. Demand for more and more oil quickly consumed the easy stuff, and the EROI fell rapidly. As we hit peak oil production in 1970, the EROI fell below 10:1. I inset a blowup of the chart, from 1950 to 2010, so that we can see how EROI has since remained firmly in the single digits.
(source: Guilford, Hall, Connor, Cleveland ?A New Long Term Assessment of Energy Return on Investment (EROI) for U.S. Oil and Gas Discovery and Production.? Sustainability 2011, 3, 1866-1887)
The EROI for Production is trending lower too. Variations in any given year are largely dependent on how much drilling it takes to produce the oil. ?Typically about 2 barrels of oil equivalent are consumed per foot of well drilled. In years where there was a lot of drilling, the EROI would be lower.
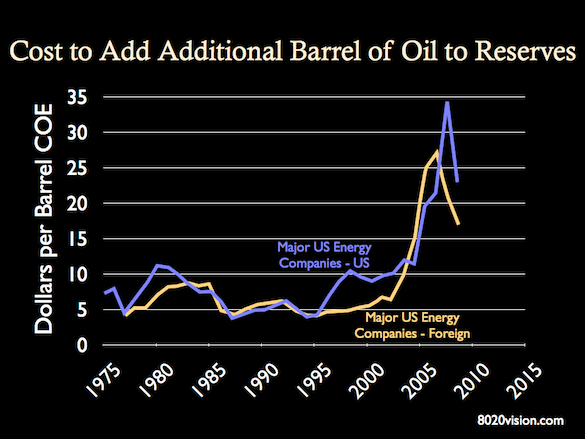
A more intuitive way to look at this trend is as dollars per barrel of oil. The chart below is from the Energy Information Administration (EIA) Annual Energy Review for 2011. It shows the cost to add each additional barrel of oil to US reserves.
COE (crude oil equivalent) measures the cost of adding 5.8 million BTUs regardless of whether the resource is oil, natural gas, or natural gas liquids. (source: EIA, 2011 Annual Energy Review)
As I mentioned above, the easy oil has been extracted. What remains is increasingly difficult to get to and refine (ultra-deep, off-shore, tar sands, shale-rock fracking, etc). ?We should expect these prices to continue their trend higher.
The Hirsch Report
In 2005, the US Department of Energy published?Peaking of World Oil Production: Impacts, Mitigation, and Risk Management, which came to be known as the Hirsch Report, named for the reports lead author, Robert Hirsch.?It examined the time frame for the occurrence of peak oil, the necessary mitigating actions, and the likely impacts based on the timeliness of those actions. From the report:
The peaking of world oil production presents the U.S. and the world with an unprecedented risk management problem. As peaking is approached, liquid fuel prices and price volatility will increase dramatically, and, without timely mitigation, the economic, social, and political costs will be unprecedented. Viable mitigation options exist on both the supply and demand sides, but to have substantial impact, they must be initiated more than a decade in advance of peaking.
The report estimated that oil production would peak in about 2015. It laid out three possible scenarios:
A scenario analysis was performed, based on crash program implementation worldwide ? the fastest humanly possible. Three starting dates were considered:
1. When peaking occurs;
2. Ten years before peaking occurs; and
3. Twenty years before peaking.The timing of oil peaking was left open because of the considerable differences of opinion among experts. Consideration of a number of implementation scenarios provided some fundamental insights, as follows:
- Waiting until world oil production peaks before taking crash program action leaves the world with a significant liquid fuel deficit for more than two decades.
- Initiating a mitigation crash program 10 years before world oil peaking helps considerably but still leaves a liquid fuels shortfall roughly a decade after the time that oil would have peaked.
- Initiating a mitigation crash program 20 years before peaking offers the possibility of avoiding a world liquid fuels shortfall for the forecast period.
The reason why such long lead times are required is that the worldwide scale of oil consumption is enormous ? a fact often lost in a world where oil abundance has been taken for granted for so long. If mitigation is too little, too late, world supply/demand balance will have to be achieved through massive demand destruction (shortages), which would translate to extreme economic hardship. On the other hand, with timely mitigation, economic damage can be minimized.
We are on a short fuse. As we ride along the top of peak oil production, spikes in demand, or disruptions in supply, will cause rapid fluctuations in the price of oil. With no ability to provide alternatives, the economy will stutter, usually in the form of a recession, which has the side effect of reducing demand. Until we transition to alternative forms of energy, we will repeat the cycle of growth, followed by hitting the peak oil wall, followed by recession.
Small is Beautiful
And as the legendary economist E.F. Schumacher points out in his seminal book Small is Beautiful, to understand the true cost of an product or initiative, we must tally both the direct costs as well as the indirect costs. When we talk about oil and gas, what is the cost of CO2 spewing into our atmosphere? What is the cost of toxic chemicals leaking into our water systems? What is the cost to public health? What is the cost of each oil war? What is the cost of funding petro-dictatorships? What is the cost to the common wealth?
What is the cost?
Fires burn around the site of the BP Deepwater Horizon rig site in the Gulf of Mexico, June 19, 2010. (source: LA Times)
Carpe Diem
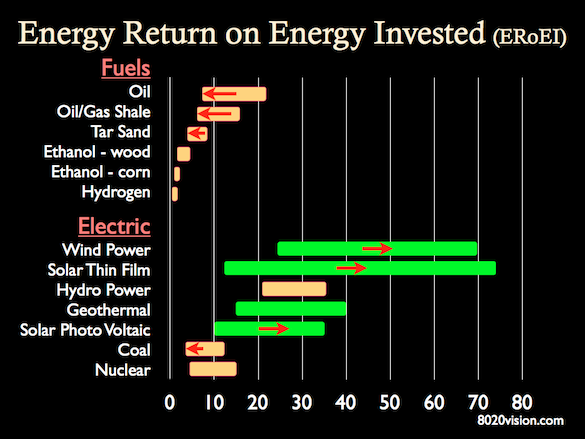
While the EROI of fossil fuels such as oil, gas, and coal plummet, the EROI for renewables such as wind and solar are trending strongly up, with EROIs five to twenty times higher than their fossil fuel counterparts.
Can the nation that pioneered the computer, telecommunications, the internet, medical technology, oil exploration, landed on the moon, etc. muster the will to do it again with alternative energy? Carpe Diem!
8020Vision
?
?
franchise tag lesotho a wrinkle in time benjamin netanyahu storm shelters nick lachey chevy volt


No comments:
Post a Comment
Note: Only a member of this blog may post a comment.